This guide is for CISOs, Heads of Fraud, and Risk Leaders who need to justify security investments in financial terms that the board values, not just technical language.
The Executive Summary
- The Challenge: Traditional Red/Amber/Green heatmaps may raise alarms, but they do not deliver the financial clarity executive leaders demand. Without a specific dollar value tied to loss, justifying your fraud budget is an uphill battle.
- The Strategic Shift: Use Annualized Loss Expectancy (ALE) modeling to connect technical risk with business priorities. By quantifying threats like Deepfakes as $7.5 million in annual risk instead of just calling them High Risk, you meet SEC and DORA materiality standards and communicate in terms the board understands.
- The Value Proposition: Move beyond counting blocked attacks. Start showing Return on Security Investment (ROSI) to prove how your controls directly protect the organization’s bottom line, not just add to expenses.
- The Outcome: Shift the conversation from simply avoiding breaches to making smart capital allocation decisions. Align your security investments with the CFO’s financial goals and show how security strengthens business resilience.
The Translation Gap: A Boardroom Reality Check
Imagine yourself in the boardroom, right after a deepfake attack that led to a $25 million wire transfer. The headlines are still fresh, and regulatory inquiries are underway.
You stand before the Board with a slide deck full of data: 10,000 phishing attempts blocked, 300 suspicious applications flagged, and a heatmap glowing with red and amber warnings.
You finish your presentation. The room is silent. Then the CFO leans forward and asks the question you have been anticipating:
“So, are we safe? If cyber-fraud hits us tomorrow, what’s the real number on the line? And if I approve this budget, how much money will we actually save? I need a dollar figure, not just colours.”
In that moment, you see every eye in the room focused on you. The technical team can report how many threats were blocked, but they cannot quantify the remaining financial risk.
This is the translation gap: when technical metrics lose their value in the boardroom because they lack financial context.
Boards do not care about the volume of attacks; they care about the dollar value of protected revenue. (The changing language of cyber: communicating with the board, 2025)
“If you cannot quantify fraud risk, you cannot govern it.”
To see where you stand, try to go back to the question the CFO asked: “How much money are we actually at risk of losing due to cyber fraud?”
Could you answer with a single dollar figure right now? If not, you are not alone. Recognizing this translation gap is the first step. The next step is to move from technical metrics to financial clarity through quantification.
With global cybercrime costs projected to hit $12.2 trillion by 2031, relying on “gut feel” or qualitative dashboards is not only a liability but a governance failure issue ready to scale. (Cybersecurity Ventures Forecasts Cybercrime Will Cost World USD$12.2T Yearly by 2031, 2025)
This guide goes beyond heatmaps. You will learn how to quantify cyber-fraud risk, turn operational friction into financial impact, and use a 30-day roadmap to answer the board’s most challenging questions.
1. Why “Gut Feel” is a Liability: The Cost of Heatmaps
For years, the industry has relied on qualitative risk assessments—the familiar High, Medium, Low charts.
As cyber-fraud becomes a top concern—73% of CEOs now rank it above ransomware—subjective measures create costly blind spots.
Picture this: you present to the board, and your first slide is the familiar heatmap with red, amber, and green zones, but no numbers. The likely reaction? Skepticism, uncertainty, or frustration.
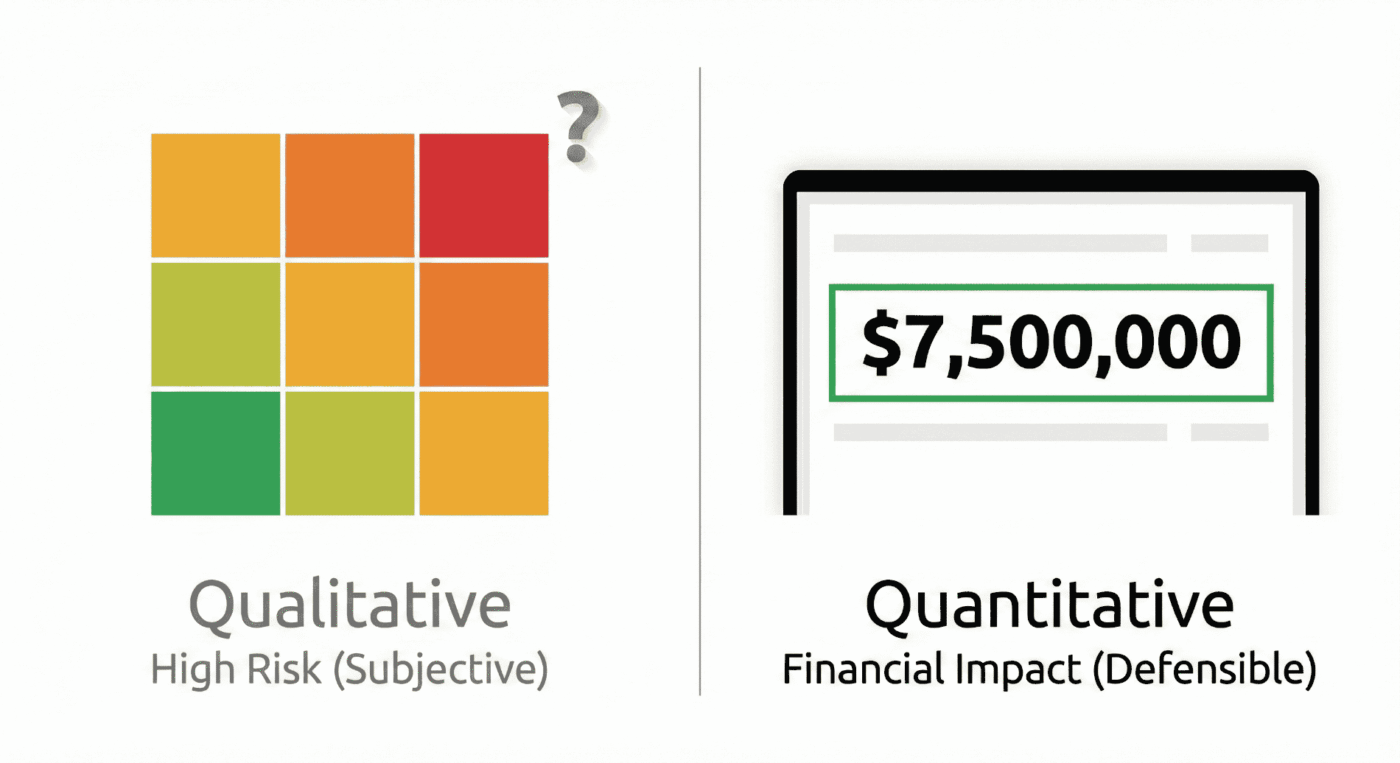
Now, your next slide shows a single number: Annualized Loss Expectancy of $7.5 million.
The conversation shifts immediately.
Questions become sharper, decisions gain urgency, and the discussion centers on measurable business risk.
Which slide would your CFO trust as the basis for budget approval?
This perspective highlights the risks of relying solely on qualitative measures.
From “High Risk” to “Unpriced Risk”
Risk leaders know the danger of being held accountable for breaches they cannot quantify.
Reporting risk as High without a dollar value forces the business to rely on your intuition rather than your analysis.
textbf{High Risk} times textbf{Unknown Impact} = textbf{Unpriced Risk}.
When a risk is labelled High, but the financial impact is not calculated, it remains unpriced.
To a Finance Committee, vague metrics cannot be defended. If you cannot prove the financial exposure, you cannot justify the budget.
The Regulatory & Fiduciary Mandate
Quantification is not optional; it is becoming a fiduciary duty.
With tightening regulations, Boards are personally liable to understand the materiality of risk. (SEC Adopts Final Rules on Cybersecurity Disclosure, 2023)
Regulatory penalties are now quantified in financial terms: for example, under DORA, EU authorities can levy fines up to 2% of a firm’s worldwide annual turnover for severe breaches. (“SEC Announces Enforcement Results for Fiscal Year 2023”)
By naming and quantifying these penalties, you make the cost of poor governance real. This is why putting a financial value on risk is essential.
- The Cost of Inaction: It’s not just possible fines. According to a 2024 Hack The Box report, cybersecurity burnout alone costs U.S. enterprises an estimated $626 million in lost productivity annually. (“Building a Firewall Against Cybersecurity Burnout”)
- The Governance Gap: There is a direct link between unquantified exposures and leadership turnover. CISO turnover exacerbates security risks, forming a vicious cycle in which a lack of clear metrics leads to blame, departures, and further vulnerability. (Inc., 2023)
- The Scapegoat Factor: Without a quantified baseline, you take on personal liability for risks the board has not formally acknowledged.
Break the cycle by reframing fraud defence as a capital-allocation challenge, not just a siloed cost center.
2. Moving from Heatmaps to Hard Numbers: The ALE Framework
To speak the CFO’s language, use Annualized Loss Expectancy (ALE). This is how you turn High Risk into business risk.
Although ALE is standard in insurance, it is often underused in fraud operations because of perceived data limitations.
If your team is worried about limited or imperfect data, you are not alone. Sparse data can still support meaningful quantification. Methods like Monte Carlo simulation work with estimated ranges, not perfect inputs. Start with what you have to build early, defensible models and improve them over time. No organization has perfect data, but every organization can benefit from better financial clarity by modeling what is known.
The Quantifiable Risk Framework
To calculate the financial weight of a specific threat (e.g., Account Takeover), use this formula:
ALE = SLE times ARO
Where:
- SLE (Single Loss Expectancy): The total monetary loss from a single occurrence.
- Pro Tip: Do not just count stolen funds. Include aggravated loss factors such as investigation hours, legal fees, customer reimbursement, and potential regulatory fines.
- For example, if a typical investigation takes 30 hours at $150/hour, legal costs reach $10,000, customer reimbursement averages $5,000 per case, and expected fines are $20,000, your aggravated loss for one incident would total $39,500.
- Refine these estimates as you gather more detailed internal data.
- ARO (Annual Rate of Occurrence): The estimated frequency of the threat happening within a one-year period.
- Data Source: Derive this from your internal historical incident logs merged with industry benchmarks like the Verizon DBIR to ground your assumptions in reality.
The goal is not perfect math, but a defensible estimate of exposure. It is better to be roughly right and protected than precisely wrong and exposed. Use industry benchmarks to support your ARO and build credibility, even if your model is not perfect.
Example: Credential Stuffing
- The Scenario: Your login portal is constantly under attack from credential stuffing.
- The ALE Way:
- SLE: One successful takeover costs $15,000 (refunds + support + fines).
- ARO: Historical logs suggest 500 compromises/year without intervention.
- Calculation:
15,000 times 500 = textbf{$7.5 M} .
Now, you present a $7.5 million exposure to the board.
If a new defence solution costs $500,000, the decision is not about technology. It is about saving $7 million.
You can spend $500,000 or risk $7 million.
In executive terms: spend $500,000 to save $7 million. That is boardroom math.
This clear contrast sharpens the investment lens for decision-makers.
3. The Deepfake Frontier: Your $25M Blind Spot
While most risk leaders calculate ALE for known threats such as account takeovers, a new variable is quietly disrupting models: deepfake-enabled fraud.
Deepfake attempts have increased by over 2,000% recently. (“Press release: Fraud attempts with deepfakes have increased by 2137% over the last three years”)
But the risk isn’t just one massive “whale” attack; it’s the “death by a thousand cuts” from automated synthetic identity fraud. (TransUnion Report Indicates Suspected Digital Fraud in Nearly 14% of All Newly Created Global Digital Accounts in 2023, 2023)
To help boards manage this evolving threat, introduce a deepfake exposure velocity metric—the rate of change in detected deepfake incidents or potential losses, measured quarter over quarter.
The “Deepfake Velocity” Metric
We recommend tracking the rate of change in detected deepfake incidents quarter over quarter.
For example, if you detected 12 deepfake incidents this quarter versus 8 last quarter, the exposure velocity is (12 - 8)/8 = 0.5 , or a 50% quarter-over-quarter increase.
The main goal of this metric is to show the direction and magnitude of change over time, giving the Board clear visibility into whether exposure is rising, stabilizing, or declining.
By tracking deepfake exposure velocity with incident counts, boards can make informed, proactive decisions instead of treating the risk as unpredictable.
The Zero-Sum Trap: Balancing Friction vs. Fraud
The biggest hurdle to stopping modern attacks is not technology. It is the fear of friction.
Growth leaders often view security measures—like liveness checks—as a “conversion tax” because they fear losing legitimate customers. Risk leaders, conversely, view every open door as a “revenue bleed” (Source: AI False Positives: The Hidden Cost Killing Customer Trust, 2026).
This creates a stalemate: tighten the rules to stop fraud, and you block good customers. Loosen the rules to boost growth, and you invite bot attacks.
To break this deadlock, move beyond False Rejection Rate (FRR), a technical metric, and adopt Net Revenue at Risk (NRAR).
Defining the Variables
- False Rejection Rate (FRR): The percentage of legitimate customers who are blocked or abandon the process due to security friction. This is the “silent killer” of growth.
- Net Revenue at Risk (NRAR): A composite financial metric that reveals the true trade-off. It subtracts the revenue lost to false rejections from the fraud losses prevented.
NRAR = text{Fraud Losses Prevented} - text{Revenue Lost to False Rejections}
The Impact: If your FRR is 3% and your average transaction is $1,000, you are not just missing a metric. You are actively subtracting $30 per transaction from your Revenue Saved column.
FRR is the variable; NRAR is the impact on your P&L.
The Solution: The Efficient Frontier of Passive Liveness
The goal is no longer “lowest possible fraud” (which often results in a high FRR).
The goal is Optimal Net Revenue.
Modern passive liveness detection is the sweet spot. Unlike legacy rules that act like a “sledgehammer” (blocking entire regions or IP ranges to stay safe), passive liveness acts like a “scalpel.” It identifies the microscopic artifacts of a bot or deepfake.
Because the signal is so precise, you can safely relax your other strict rules. You stop rejecting real humans for minor typos or unusual IP addresses because you know they are legitimate. This allows you to lower your FRR and recover revenue previously lost due to assumed fraud.
In Practice: The Digital Bank Scenario
Consider a digital bank facing bot-driven synthetic identity attacks. They were paralyzed by the fear of blocking legitimate users.
- The Problem: Their old rules were blunt. To stop bots, they had to reject 5% of all applicants.
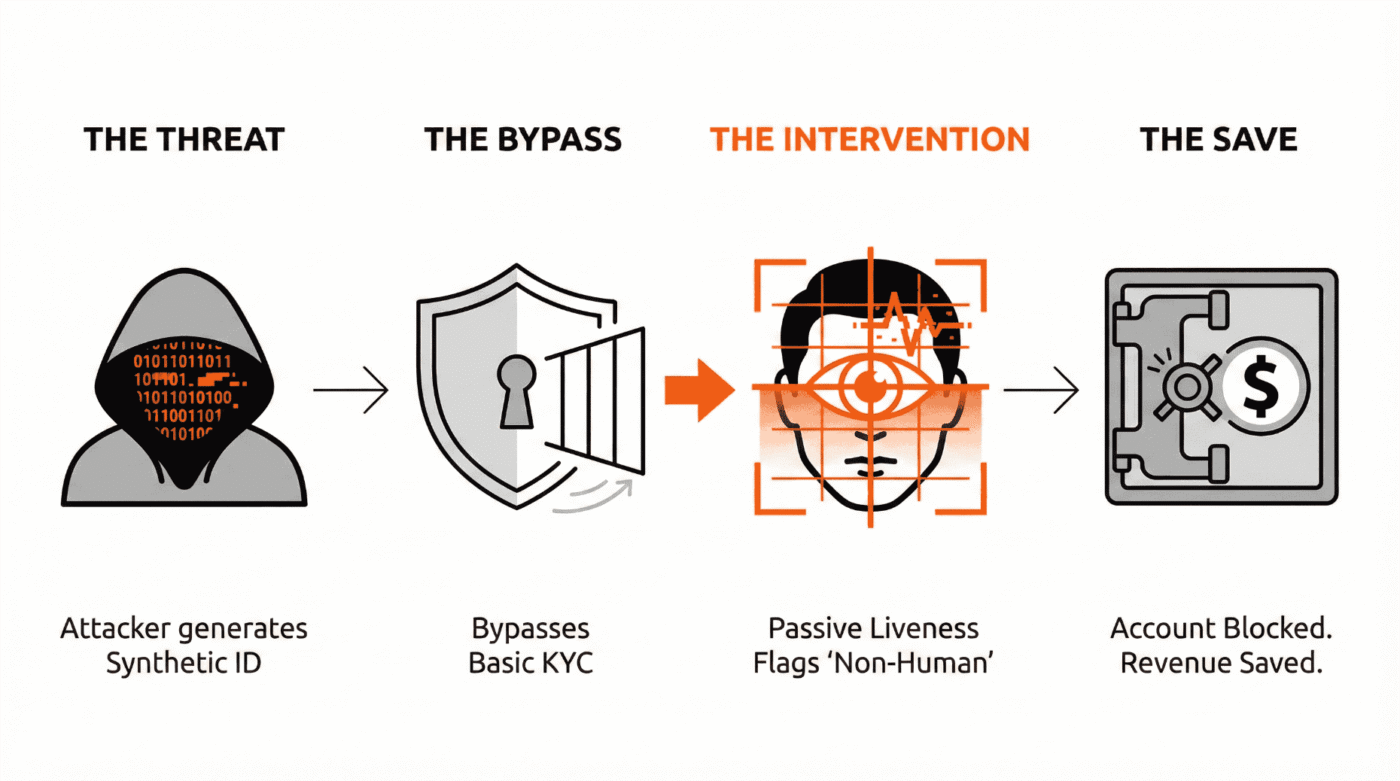
- The Action: They implemented passive liveness detection to filter non-human traffic without adding user friction.
- The Result (Defence): The tool caught the sophisticated deepfakes that bypassed basic checks, reducing direct fraud losses by $900,000 annually.
- The Result (Growth): Because the new system was higher-fidelity, the Risk team felt safe retiring their old, aggressive blocking rules. This reduced their False Rejection Rate, recapturing an estimated $250,000 in Annual Customer Lifetime Value (LTV) that was previously lost.
Our Perspective: Modern passive liveness is not a trade-off. It is a revenue protector. By optimizing for Net Revenue at Risk, you show the Board that high-fidelity security accelerates business by removing the manual review bottleneck.
Executive Reality Check:
If you cannot tell the Board exactly how much revenue your current FRR is costing each month, you are not managing a strategy. You are managing a blind spot.
4. From Cost Center To Revenue Preservations: The ROSI Framework
The paradox of security is that when you do your job perfectly, nothing happens. With no incidents or losses to report, it becomes difficult to prove value.
How do you calculate the ROI of an event that never happened?
CISOs often ask,
“What KPIs demonstrate security value to non-technical stakeholders?”
The answer lies in calculating the ROI of cyber fraud defence (often called ROSI – Return on Security Investment).
The ROSI Formula
To defend your budget, you need to show the efficiency of your spending.
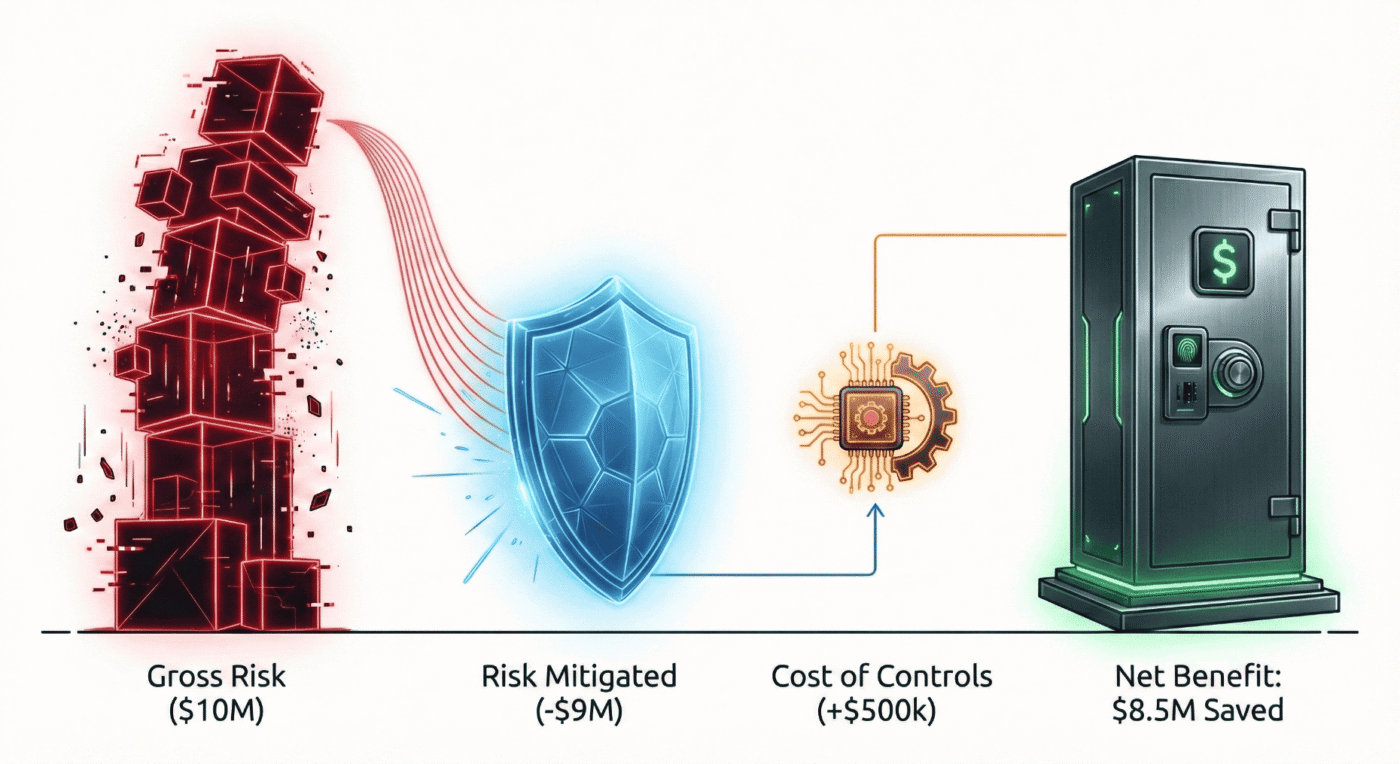
ROSI = frac{(text{Risk Reduction} - text{Cost of Control})}{text{Cost of Control}}
- Risk Reduction: The monetary value of the losses you prevented (derived from your ALE calculations).
- Cost of Control: The Total Cost of Ownership (TCO). Include software licensing, management personnel, headcount, and deployment costs.
The Language of Approval: NPV & Payback Period
To truly win the boardroom, align your ROSI results with the capital budgeting concepts your CFO uses every day. This shifts your proposal from a necessary evil to a priority investment.
- Net Present Value (NPV): Don’t just look at this year. Calculate the NPV of fraud losses prevented over the three-year lifespan of the control. When you show that a $200,000 investment prevents $6 million in discounted future losses, you are speaking the language of value creation.
- The Payback Period: CFOs love a “Quick Win.” Demonstrate how quickly savings from reduced fraud and recaptured revenue (NRAR) offset the initial cost.
The Example Business Case:
It is estimated that manufacturing and other capital-heavy industries lose up to 5% of revenue to fraud annually. (“Occupational Fraud 2024: A Report to the Nations”)
Imagine a manufacturing firm losing 5% of its $100 million revenue to fraud. That means $5 million lost each year.
- The Investment: $200,000 total cost of ownership for an AI-driven liveness and detection stack.
- The Impact: 50% reduction in fraud, or $2.5 million saved.
- The ROSI:
frac{($2.5M - $200k)}{ $200k} = 11.5x text{ ROI} .
- The Payback Period: 29 days. The investment pays for itself in less than a month.
Executive Insight:
When you present an 11.5x ROSI with a payback period under 30 days, you are not asking for budget. You are presenting a capital allocation opportunity that is mathematically stronger than almost any other initiative on the CFO’s desk.
By focusing on targeted actions and combining internal collaboration with external data, you accelerate your path to a defensible, resilient risk model.
5. The Compliance Shield: Mapping to Mandates
Regulators are no longer asking if cyber and fraud risks exist. They want to know if leadership can measure, govern, and disclose material exposure.
Quantified fraud metrics directly map to regulatory expectations across jurisdictions.
For example, using the ALE (Annualized Loss Expectancy) model provides a defensible, dollar-value estimate of potential cyber fraud losses.
Under SEC rules, this satisfies the need to demonstrate ‘material’ cyber risk in financial terms.
For DORA compliance in the EU, scenario-based calculations, such as ALE and deepfake exposure velocity, fulfill the requirements for rigorous ICT risk measurement and operational resilience.
Calculating ROSI also helps show regulators and compliance officers how security controls reduce exposure and justify spending. This supports expectations for transparent board oversight and capital allocation.
By quantifying both risks and control impacts, your organization aligns reporting with the requirements of major global regulators.
Metric To Regulator Requirements Mapping Table
This isn’t optional anymore.
Quantified metrics are your best professional defence in a regulatory audit.
| Quantified Metric | SEC (US) | DORA (EU) | OSFI (Canada) | FINTRAC (Canada) |
|---|---|---|---|---|
| Total Annual Fraud Exposure (ALE) | Material cyber risk disclosure (Reg S-K) | ICT risk quantification & impact analysis | Aggregate risk appetite & capital adequacy | Enterprise-wide ML/TF risk assessment |
| Single Loss Expectancy (SLE) | Incident materiality threshold | Severe but plausible loss scenarios | Operational risk loss modelling | High-risk transaction exposure |
| Annual Rate of Occurrence (ARO) | Incident frequency trends | Threat-led penetration testing inputs | Control effectiveness & residual risk | Suspicious transaction pattern analysis |
| Risk Reduction ($) | Disclosure of mitigation effectiveness | Risk treatment outcomes | Risk control validation | Effectiveness of AML controls |
| Cost of Inaction ($) | Forward-looking risk statements | Business continuity & resilience planning | Stress testing | Consequence-based risk assessment |
| ROSI / ROI of Controls | Governance oversight evidence | Cost-benefit justification | Prudent investment in controls | Proportionality principle |
Regulator-Specific Callouts
SEC (U.S.) — Cyber Risk Disclosure.
“Quantified fraud exposure supports materiality determination under SEC cyber disclosure rules by translating cyber incidents into financial impact.”
DORA (EU)
“ALE and deepfake loss modeling directly support DORA’s requirement for ICT risk measurement, scenario testing, and operational resilience.”
OSFI (Canada)
“Financial quantification of fraud risk aligns with OSFI’s expectations for enterprise risk management, operational risk capital, and board oversight.”
FINTRAC (Canada)
“Synthetic identity and fraud-loss modelling strengthens enterprise-wide ML/TF risk assessments and supports proportional control design.”
The Mental Model: The TAR Rule—Three Numbers Board Members Remember
Make your message stick with the TAR Rule: Total, Avoided, Residual.
This simple acronym helps directors recall the three numbers that matter most long after the meeting ends.
- Total Annual Fraud Exposure ($): “Our current quantified risk based on ALE modelling.”
- Avoided Losses ($): “Revenue preserved this quarter by current controls.”
- Residual Risk or Cost of Inaction ($): “The projected financial loss if we delay the investment.”
If you present only these TAR figures, you give executives a clear takeaway they can repeat internally and reference easily.
Once you know what the board needs, execution sets you apart.
6. How to Start Quantifying Fraud Risk in 30 Days
Theory is useful, but execution secures the budget. Here is your operational roadmap to move from gut feel to board-ready in 30 days.
Weekly Action Items
Week 1:Gather 12 months of historical loss data.
Data Gathering. Pull historical fraud loss data for the last 12 months. Categorize by threat type (e.g., ATO, New Account Fraud).
Quick tip: In Week 1, identify key stakeholders early, especially in finance and legal, to ensure smooth data collection. Secure a finance point of contact from the start and communicate the business value of this exercise to drive cooperation. This proactive step helps avoid common week-two delays and keeps your 30-day sprint on track.
Week 2: Assign a “Fully Loaded” cost (SLE) to each incident type.
Assign SLE. Work with Legal and Finance to assign a “fully loaded” cost to each incident type. Don’t forget the hidden costs (investigation time, brand reputation).
Week 3: Model frequency (ARO) using internal logs and benchmarks.
Model ARO. Use your internal logs and external benchmarks (Verizon DBIR) to estimate the frequency of attacks for the coming year.
Week 4: Present the “Cost of Inaction” to your CFO to agree on the math.
The Baseline Report: Calculate your initial ALE and present the Cost of Inaction to your CFO to align on the methodology before requesting budget. Clearly outline your assumptions, data sources, and calculation steps in the baseline report. CFOs want transparency in how SLE and ARO were determined, the rationale for any industry benchmarks, and clarity on how costs and losses are calculated.
Boardroom Presentation Tip: When presenting to the board, focus on three core numbers: total annual fraud exposure, risk reduction achieved, and the cost of inaction. Use clear, straightforward language and minimize technical jargon.
Visual aids like simple charts or a one-page executive summary help board members quickly understand your message. Lead with concrete financial numbers and their real-world impact to make your presentation memorable and actionable.
Why You Need This Now: The Cost of Waiting
Most firms treat risk quantification as a Year 2 project. In today’s regulatory climate, that assumption can end your career.
- Regulators are watching. SEC and DORA mandates now require materiality reporting. You cannot define materiality with a red heatmap.
- The Unpriced Risk Penalty: Markets and insurers are increasingly penalizing firms that cannot show defensible math for their fraud spending.
- The Scapegoat Factor: When a major deepfake attack happens, the first question will be whether you knew it was possible and why it was not included in the budget.
Conclusion: Take Control of the Narrative
To turn insight into action, schedule a 30-minute alignment meeting with your CFO this week. Use this conversation to present your topline fraud exposure, clarify risks in dollar terms, and agree on the roadmap for quantification. The momentum starts when you move the conversation from risk theory to financial clarity. It begins with this one commitment on your calendar.
The shift from qualitative heatmaps to financial models is essential for today’s leaders. You are no longer the person who says No. You are the partner who says, Here is how much risk we can afford to take.
Option A: Benchmark Your Maturity
“I need to see where our blind spots are.”
Take the Cyber-Fraud Visibility Diagnostic. Based on our proprietary framework, this 5-minute assessment measures your organization against the 5 pillars of Risk Maturity.
The Outcome:
- Your Visibility Score (0–100): See exactly where you sit (Nascent to Optimized).
- The 40-Page Visibility Blueprint: A customized implementation strategy tailored to your score.
Option B: Immediate Strategic Intervention
“I need to connect right away.”
If you need to connect with our team right now, book a Confidential Strategy Session.
Possible Outcomes:
- The Board-Ready Narrative: How to frame your current risk in language the CFO trusts.
- The Compliance Shield: Identification of the three metrics you need for defensibility.
- Personal Accountability Audit: Identifying where you are currently exposed.
Availability is limited to a select number of organizations each month.
Frequently Asked Questions
Yes, provided you frame it correctly. ALE is not a prediction of the future, but a model of exposure based on historical data. By using industry benchmarks (like the Verizon DBIR) to bracket your estimates, ALE provides a defensible baseline for capital allocation, which is far superior to subjective “High/Medium/Low” heatmaps.
To get an accurate ROSI (Return on Security Investment), you must calculate the Total Cost of Ownership (TCO). This includes the direct cost of the software license, the internal headcount required to manage the tool, implementation fees, and any infrastructure costs (like cloud ingress/egress fees).
Yes, using Scenario Modeling. You can estimate the potential Single Loss Expectancy (SLE) by analyzing the maximum transaction limits a “verified” user has access to (e.g., if a deepfake bypasses KYC, what is the maximum amount they can transfer?). Multiply this by the rising industry frequency of deepfake attacks to model your potential exposure.
ROI (Return on Investment) typically measures the profit generated by an asset. ROSI (Return on Security Investment) measures the loss an asset prevents. Since security tools rarely generate direct revenue, ROSI is the appropriate metric to demonstrate value by showing how much revenue was preserved relative to estimated losses.
A defensible baseline can be established in as little as 4 hours of focused data gathering. For a full organizational alignment, it can take about 30 days. Week 1 is for data gathering (historical losses); Week 2 is for assigning financial values to incidents (SLE); Week 3 is for estimating frequency (ARO); and Week 4 is for calculating your initial exposure and presenting it to leadership.
External Sources & Regulatory References
Accessed: 2025
- Verizon Data Breach Investigations Report (DBIR) — global industry standard for historical attack frequency (ARO) data.
- ACFE Report to the Nations (2024) — primary source for the “5% of annual revenue lost to fraud” statistic.
- The FAIR Institute — the international standard model for Factor Analysis of Information Risk.
- Hack The Box: The Security Distress Report (2024) — data on the $626M cost of cybersecurity burnout and turnover.
- U.S. SEC Cybersecurity Disclosure Rules — mandates for public companies on material risk disclosure and governance.
- EU Digital Operational Resilience Act (DORA) — regulatory framework for ICT risk management in the financial sector.
- NYDFS Part 500 Cybersecurity Requirements — standards requiring financial services to certify the effectiveness of controls.
- FBI IC3 Annual Report (2024) — statistics on BEC and investment fraud losses rooted in identity compromise.
- NIST Digital Identity Guidelines — standards for identity proofing, biometrics, and resistance to presentation attacks.
- Deloitte: The Future of Identity and Deepfakes — analysis of the rising financial impact of synthetic media attacks.
About the Author
Dr. Joseph Mwangoka is the Founder & Lead Consultant at BranchedFlow Inc.. He advises financial institutions and fraud leaders on cyber-fraud quantification, digital trust architecture, and AI-enabled risk governance. His work focuses on translating fraud exposure into board-level financial decision frameworks.
Disclaimer: This article is for educational purposes only and does not constitute legal, financial, or cybersecurity advice.