- The Problem: False positives cost the digital economy $443 billion annually—10x the cost of actual fraud.
- The Risk: 40% of customers abandon a merchant permanently after a single false decline (LTV Suicide).
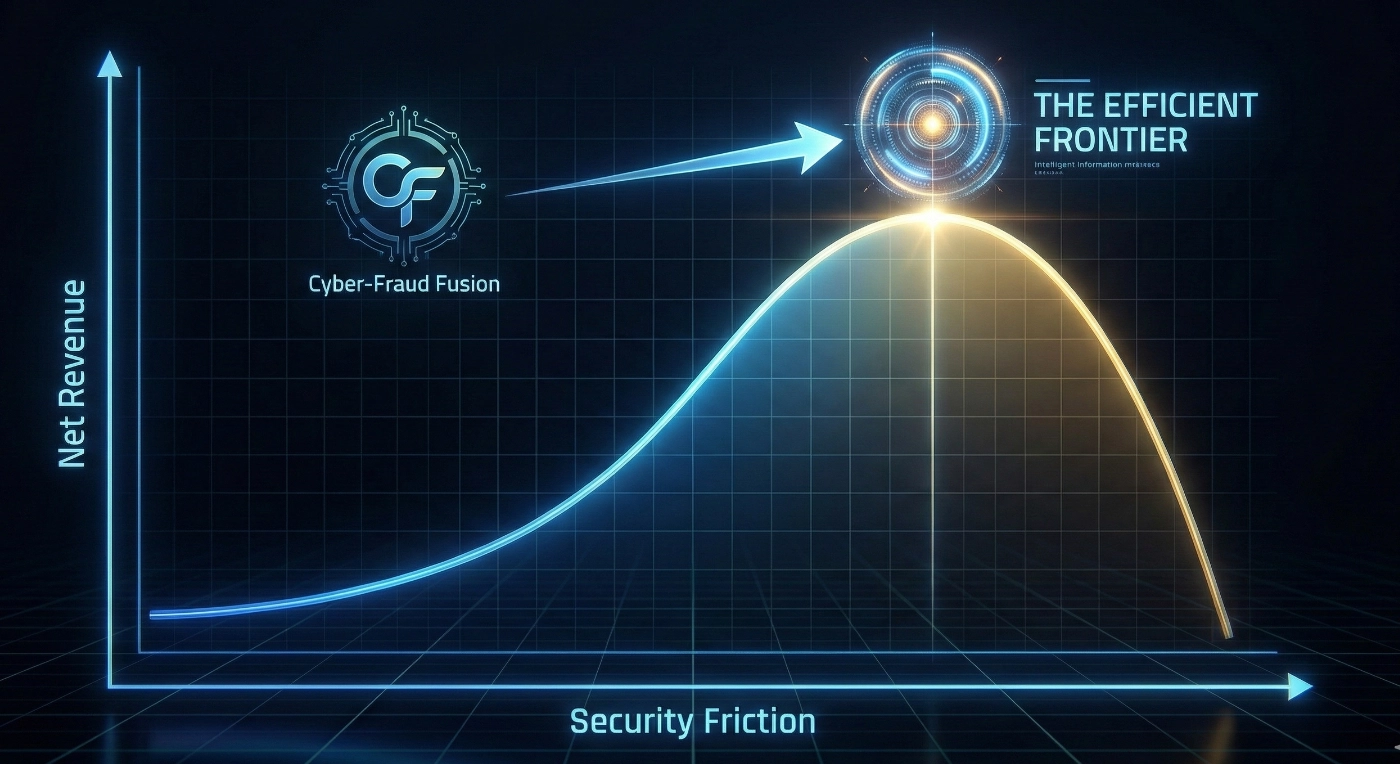
- The Solution: Transitioning to a Cyber-Fraud Fusion Model to recover trapped revenue and protect enterprise valuation.
- The Metric: Friction-Adjusted Conversion is the new North Star for the “Cyber CFO.”
Introduction: The Silent Erosion of Enterprise Value
The Hidden Economics of False Declines (The True Cost of a “No”)
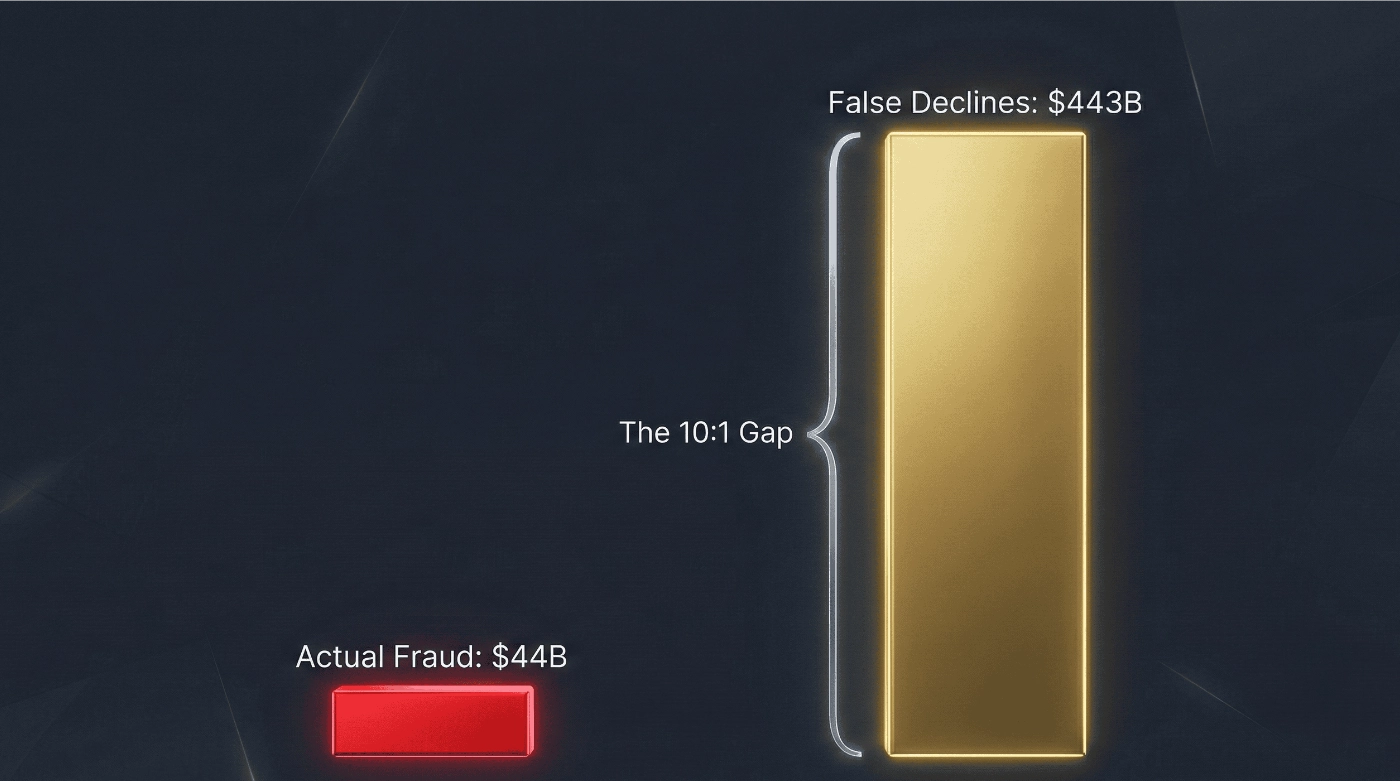
How does the 10:1 False Positive Ratio impact Fraud ROI?
The Financial Imbalance: Merchants lose 10x more to false declines than actual fraud.
When your risk appetite is set by blunt, binary rules—”Block all transactions from X region” or “Flag all orders over $Y”—you aren’t just stopping thieves. You are firing your best customers.
What is the “Silo-Tax” in Cybersecurity and Fraud Operations?
Immediate Financial Visibility
LTV Suicide: The High Cost of “Firing” Your Best Customers
Public Insult vs. Technical Error: Why 40% of customers abandon the brand forever.
The “Exit Interview” You Never Get
The Cyber-Fraud Fusion Model: Turning Risk into a Velocity Engine
- A Fiduciary Imperative: Why tool adjustments won’t solve a structural valuation drain.
- Structural Integration: Defining the Cyber-Fraud Fusion Model.
How do you integrate SOC signals with fraud prevention to eliminate the “Silo-Tax”?
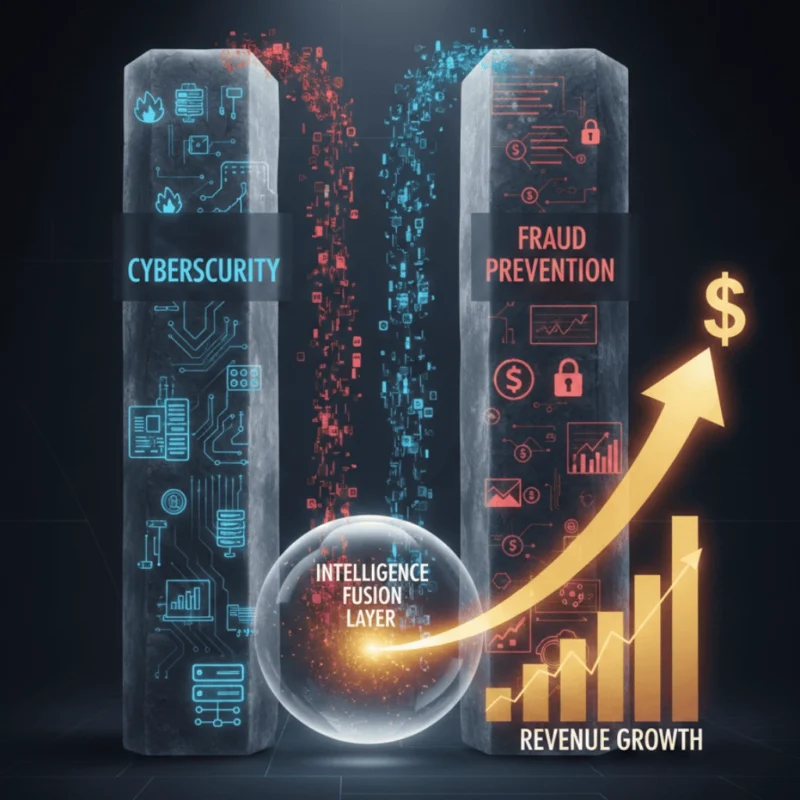
The Architecture of Intelligence Fusion
- Technical Signals (SOC): Monitoring for bot signatures, travel VPNs, lateral movement, and device spoofing.
- Financial Signals (Fraud): Monitoring for account changes, transaction velocity, and beneficiary anomalies.
- The Fusion Result: Instead of two separate “risk scores,” you generate a single, high-confidence decision. This allows you to surgically block a bot while white-gloving a VIP customer who happens to be logging in from a new device.
You stop the $1 thief with surgical precision while clearing the path for the $13 customer, who would otherwise have been blocked.
Reducing Operational Friction
🏛️ The Compliance Imperative: OSFI B-13 and DORA
- OSFI B-13 (Canada): The Technology and Cyber Risk Management guideline explicitly requires financial institutions to have integrated incident management. A Fusion model addresses the mandate for “timely detection and response” by ensuring that cyber-led fraud is identified before it impacts the balance sheet.
- DORA (EU): The Digital Operational Resilience Act demands a “harmonized” approach to ICT risk. Siloed teams directly violate DORA’s spirit of holistic resilience. By unifying SOC signals with fraud monitoring, firms move from “ticking boxes” to demonstrating the Control Agility required to survive a systemic attack.
The Compliance Bonus: Beyond avoiding fines, firms that demonstrate fusion-level maturity often benefit from lower insurance premiums and a reduced Equity Risk Premium, as regulators and auditors view integrated operations as a sign of superior corporate governance.
The Business Case for the Cyber CFO: From Cost Center to Profit Accelerator
- Revenue Velocity: By reducing the False Positive Rate (FPR), you capture a 5–9% increase in top-line conversion without spending a single extra dollar on marketing.
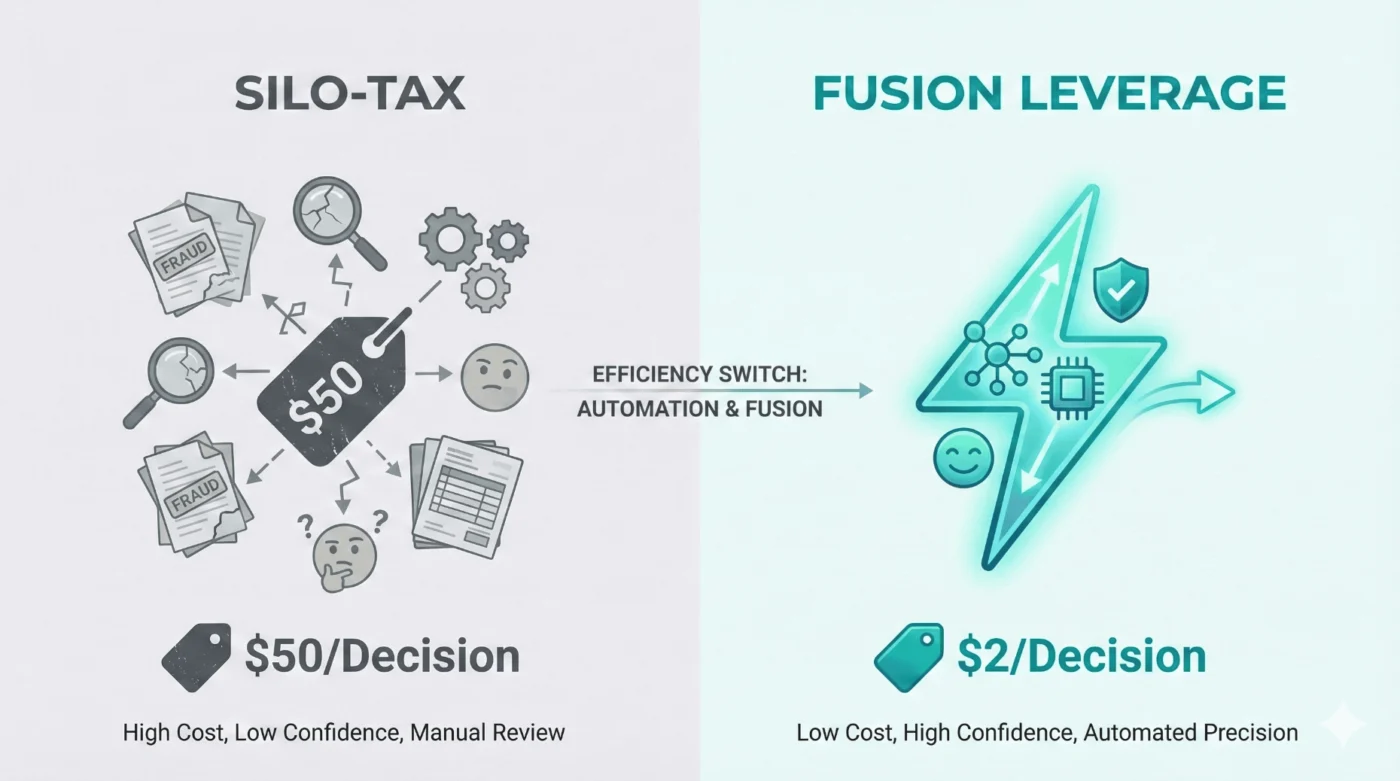
- Operational Leverage: Moving from manual, siloed reviews (costing $25–$50 per alert) to an automated fusion system (costing $2–$5) turns your risk department into a high-margin profit center.
Friction-Adjusted Conversion: The New North Star
The Missing North Star: Friction-Adjusted Conversion (FAC) Formula
\text{FAC} = \left( \frac{\text{Approved Transactions} - \text{False Positives}}{\text{Total Transaction Attempts}} \right) \times \text{LTV Index} - Total Transaction Attempts: Every customer who hits the “buy” button.
- False Positives: Legitimate customers you blocked (the $443B leak).
- LTV Index: A weighted multiplier based on the Lifetime Value of the segment (e.g., a VIP customer has a higher index than a first-time guest).
The Strategic Logic: This metric compels the Fraud team to prioritize the “Good” customer, not just the “Bad” thief. It measures the quality of your growth, not just the volume of your blocks.
Unlocking Operating Leverage
Revenue Velocity:
A sophisticated Fusion Model can dramatically reduce the FPR. The revenue impact is substantial: merchants implementing integrated fraud detection experience a 5-9% increase in top-line conversion by approving more legitimate customers—revenue growth achieved without spending another dollar on marketing.
The multiplier effect further amplifies this impact. Industry analysis reveals that every $1 in false declines results in approximately $13 in total losses, including wasted customer acquisition costs and lost customer lifetime value.
Margin Expansion:
Real-world implementations demonstrate measurable results. Integration of advanced fraud intelligence with issuer systems has achieved up to 25% reductions in false declines, translating directly to millions in recovered revenue.
Even modest improvements deliver significant returns: a 1% increase in approval rates can mean 1,000 additional approved orders per 100,000 transactions.
With customer acquisition costs (CAC) rising, every increase in effective conversion is pure profit. Approving more legitimate customers drives sales growth without additional marketing spend.
Assuming the Cyber CFO Mandate: Security as a Fiduciary Lever
- Reduction in False Positive Rate (FPR): Tracking the percentage drop in good transactions incorrectly declined over a given period.
- Increase in Friction-Adjusted Conversion: Measuring the percentage of approved transactions multiplied by their associated lifetime value, compared before and after improvements are implemented.
- Manual Review Cost Savings: Calculating the reduction in operational spend as automated decisioning increases and unnecessary manual reviews decrease.
- Recovered Revenue from Reduced Customer Churn: Quantifying the uplift in retained customer lifetime value attributed to fewer false declines.
The Evolution of ROSI: From ALE to Equity Protection
1. The Risk Baseline: Annualized Loss Expectancy (ALE)
ALE = SLE \times ARO- SLE (Single Loss Expectancy): The total cost of one fraud incident.
- ARO (Annualized Rate of Occurrence): How often that incident happens per year.
The Annual Loss Expectancy (ALE) quantifies the financial impact of anticipated fraud as the “Price of Inaction” on the P&L, showing the Board the expected losses without preventative measures.
2. The Revenue Engine: Friction-Adjusted Conversion (FAC)
\text{FAC} = ( \frac{\text{Approved Transactions} - \text{False Positives}}{\text{Total Transaction Attempts}} ) \times \text{LTV Index} By applying the FAC formula, we identify “Trapped Revenue”—legitimate customers being blocked by the same rules intended to stop the ALE.
3. The Combined Impact: Total Loss Reduction
\text{Total Loss Reduction} = (\text{Fraud Losses Prevented}) + (\text{Recovered Revenue from FAC}) - Fraud Losses Prevented: Direct savings from blocked cyber-fraud attacks.
- Recovered Revenue: Sales captured by approving legitimate customers who were previously blocked.
- Valuation Multiple: The sector-specific multiplier (e.g., 4x for Fintech, 8x for SaaS) applied in the FAC.
This is your Total Loss Reduction. This represents the total “Found Money” that moves from a projected loss to actual Gross Margin.
The Enhanced ROSI Formula (The Multiple Effect)
Total Loss Reduction is just cash; Enhanced ROSI is wealth.
\text{Enhanced ROSI} = \frac{(\text{Total Loss Reduction} \times \text{Valuation Multiple}) - \text{Cost of Fusion}}{\text{Cost of Fusion}} We take that “Found Money” and apply the Valuation Multiple (e.g., 4x). Because the market values recurring, high-margin revenue more than a one-time savings, the Enhanced ROSI shows that a $1M recovery in FAC is a $4M increase in Enterprise Value.
The Fiduciary Lever: Equity Risk Premium & WACC
- The Result: Since valuation multiples are the inverse of the Discount Rate, when you lower the Cost of Equity by even 1%, you gain an automatic expansion of your valuation multiple.
A lower Risk Premium leads to a lower Weighted Average Cost of Capital (WACC). Lower capital costs mean the company is more profitable to operate, which naturally increases the valuation multiple further.
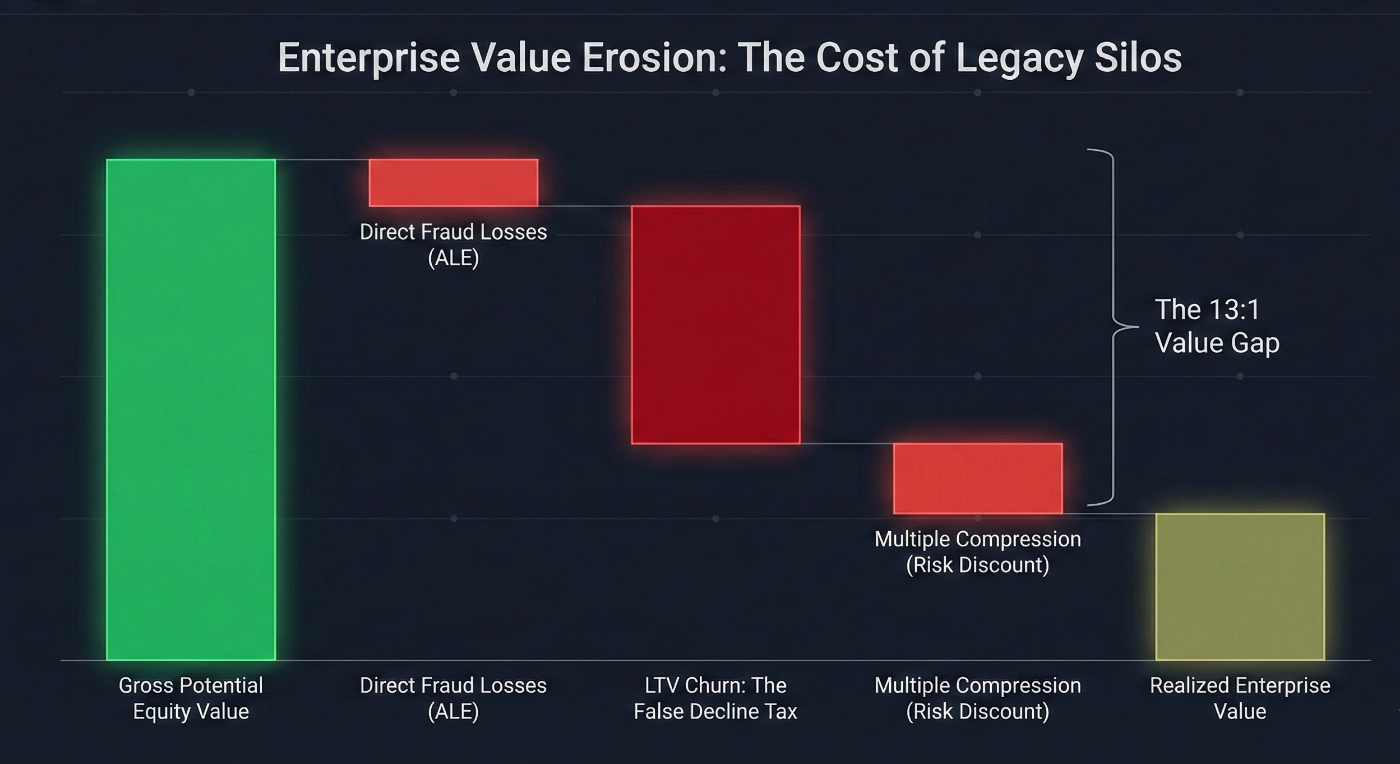
The 13:1 Justification
- $1: Direct revenue protected from the thief we stopped (ALE).
- $4: Prevention of wasted FCAC (Customer Acquisition Cost) and lost LTV.
- $8: Market capitalization protected by applying a conservative Valuation Multiple (e.g., 2x to 4x) to that recovered revenue, i.e. the equity value we protected (Multiple + WACC advantage)
Board-Ready Metrics: Reporting on the “Velocity Engine”
| Metric | What it Tells the Board | The Velocity Impact |
|
Friction-Adjusted Conversion
|
Net conversion minus LTV lost to friction. |
Directly connects security performance to Revenue Velocity and Top-Line Growth.
|
|
The 13:1 Value Gap
|
Ratio of Equity Value lost vs. Fraud prevented. |
Highlights the Capital Efficiency & ROI of current risk settings.
|
|
Realized Revenue Recovery
|
Cash saved by fused intelligence vs. blunt rules. |
Rebrands the security budget as a Profit Center with Direct Margin Expansion.
|
|
Cost Per Decision (CPD)
|
Total OpEx per transaction approval. |
Demonstrates Operational Scalability and leverage.
|
The “Cyber CFO” Summary
Conclusion: The New Mandate for the CISO: Cyber CFO
- The Systemic Fix: Moving beyond “security as insurance” to “security as profit.”
- The Scalability Factor: Why this model works for both enterprise and high-growth mid-market firms.
How to Implement a Cyber-Fraud Fusion Model (30-Day Roadmap)
|
Phase
|
Milestone
|
Key Deliverable
|
|
Week 1: Audit
|
The Trapped Revenue Baseline
|
Quantify the 10:1 ratio and the current False Positive Rate (FPR). |
|
Week 2: Diagnostic
|
Signal Silo Mapping
|
Identify where SOC signals are not reaching fraud engines. |
|
Week 3: Integration
|
The Intelligence Fusion Layer
|
Deploy middleware or unified data streams to correlate cyber & fraud events. |
|
Week 4: Execution
|
Friction-Adjusted Conversion
|
Launch a real-time dashboard reporting on recovered equity value. |
Unlock Revenue Now
🚀 Ready to Unlock Your Trapped Revenue?
Stop guessing your false-positive rates and start measuring the Profit of Resilience.
Most legacy systems hide the true cost of friction; our 13:1 Valuation Gap Analysis brings it into the light.
In this confidential 30-minute diagnostic, we will help you:
-
Baseline your “Silo-Tax”: Quantify the revenue leak between your SOC and Fraud monitoring.
-
Calculate your Friction-Adjusted Conversion: See how your risk posture is impacting LTV.
-
Draft your Boardroom Case: Receive a high-level summary of your recovered equity potential to share with your CFO.
Zero “rip-and-replace” required. Just clear, defensible data.
🏛️ Secure Your Fiduciary Defensibility
Is your current cyber-fraud silo a regulatory liability?
Schedule a Cyber-Fraud Fusion Readiness Review.
We’ll evaluate your alignment with DORA/OSFI B-13 standards and provide a roadmap to transition from a defensive cost center to a resilient, growth-oriented Cyber CFO model.
Frequently Asked Questions
While often used interchangeably, they represent different stages of failure. A False Positive is a system event where an honest user triggers a fraud flag. A False Decline is the business outcome—the actual blocking of that legitimate transaction. In short, the False Positive is the “misdiagnosis,” and the False Decline is the “unnecessary surgery” that costs you, the customer.
- Strategic Diagnostic (1 week): Quantifying your “Trapped Revenue” baseline.
- Intelligence Fusion Design (4–6 weeks): Building the unified data layer and signal correlation.
- Full Trust Architecture (3–6 months): Scaling integrated controls across the enterprise.
Research Sources & Industry References
Accessed: 2026
- LexisNexis Risk Solutions — The True Cost of Fraud in the Digital Economy (2024) — documents that total fraud costs significantly exceed direct losses, driven by operational overhead and false declines.
- Forrester — Online Fraud and the Customer Experience — establishes the link between false declines, customer abandonment (often 30–50%), and lifetime value erosion.
- McKinsey & Company — The Cost of Customer Friction — demonstrates how reducing friction in customer journeys directly improves revenue and conversion rates.
- McCrindle — How AI and Machine Learning Are Driving Down the Cost of Fraud Management — outlines operational cost reductions achieved through automation and reduced manual review.
- SSRN — Cyber Risk and Capital Structure: What Is the Real Impact of a Breach? — academic research supporting the impact of cyber incidents on equity risk premium and cost of capital.
- FIS — Increased Approval Rates & Reduced eCommerce Fraud Liability (2022) — reports 5–9% average conversion uplift through reduced false fraud declines.
- ClearSale — The Impact of Fraud Prevention Rules on Approval Rates (2024) — establishes that each $1 in false declines can equate to $13 in total revenue impact.
- Riskified — How Much Does a False Decline Cost Your Business? (2025) — documents measurable revenue gains from reducing false positives.
- Signifyd — What Is Payment Approval Percentage & How to Improve It (2025) — quantifies the revenue impact of small approval-rate improvements.
- McKinsey & Company — Financial Crime and Fraud in the Age of Cybersecurity (2019) — case studies of integrated cyber-fraud operations reducing costs and improving end-to-end decision making.
- FS-ISAC — Levelling Up: A Cyber Fraud Prevention Framework for Financial Services (2025) — actionable framework for integrating cybersecurity, fraud, AML, and financial crime functions.
- J.P. Morgan — False Positives & Fraud Prevention Tools (2023) — discusses operational and customer impact of false declines.
- Cyber Tech Journals — AI False Positives: The Hidden Cost Killing Customer Trust (2026) — analysis of trust erosion and long-term brand impact from excessive false positives.
- TransUnion — Global Fraud Report (2025) — reports fraud cost levels as a percentage of revenue across industries.
- CU Today — Fraud Losses Multiply Costs for Financial Institutions (2025) — coverage of LexisNexis findings on total fraud cost multipliers.
- Retail TouchPoints — Merchants Are Losing Billions to Failed Payments (2025) — executive analysis of revenue leakage from failed transactions.
- nSure.ai — Breaking the Cycle of Static Fraud Prevention Rules (2024) — discusses adaptive AI approaches to reducing friction and static rule dependency.
About the Author
Dr. Joseph Mwangoka is the Founder & Lead Consultant at BranchedFlow Inc.. He advises financial institutions and fraud leaders on cyber-fraud quantification, digital trust architecture, and AI-enabled risk governance. His work focuses on translating fraud exposure into board-level financial decision frameworks.
Disclaimer: This article is for educational purposes only and does not constitute legal, financial, or cybersecurity advice.